
How to Create a Marketing Mix Model with Google’s Meridian
Learn the steps to train marketing data, and get insightful information with Meridian.


Some time ago, Google announced its plans to remove third-party cookies from Google Chrome, due to Google’s Privacy Sandbox initiative to minimize users’ exposure to surveillance advertising and reduce cross-site tracking.
The reactions to this rumor were, and still are, extremely polarised. On one hand, users who prioritize their privacy were happy with this decision. On the other hand, marketers saw it as a threat to the way they do business.
As of today, this measure hasn’t been fully implemented, with only a small percentage being affected. However, many browsers, such as Brave and Firefox, already block third-party cookies by default, and even Chrome is moving into a user-choice approach, making the overall cookie environment not a solid source of user information.
With user tracking becoming less effective, marketers cannot confidently determine which channels are driving ROAS (Return On Ad Spend).
This is where the Marketing Mix Modeling (MMM) plays a key role.
The MMMs analyse aggregated data (spending, impressions, reach, sales) across multiple channels, and they use time-series data to estimate how these activities influence the sales (organic and non-organic)
There are a few MMM frameworks worth exploring, such as Meta’s Robyn, PyMC Marketing, and Meridian, but in this article, we are going to focus on the latter, not only because it’s extremely user-friendly and open-source, but also because it clearly accounts for the combination between paid and organic channels.
We will start by understanding how Marketing Mix Modeling works, and then we’ll dive into the steps to train a model and use it to gather insights with Meridian’s built-in functions and dynamic charts.
How Marketing Mix Modeling works
Marketing Mix Modeling, as the name suggests, is an analytical approach that uses a “mix” of marketing inputs, such as spend, impressions, clicks, reach, promotions, and more, to estimate their impact on sales and revenue through Machine Learning (ML) algorithms.
The statistical models behind MMMs are typically multivariate regressions or Bayesian models. They rely on historical time-series data across all marketing channels, along with seasonality and trends.
Google’s Meridian framework follows a Bayesian approach, combining prior knowledge with observed data to estimate media effects while quantifying uncertainty.
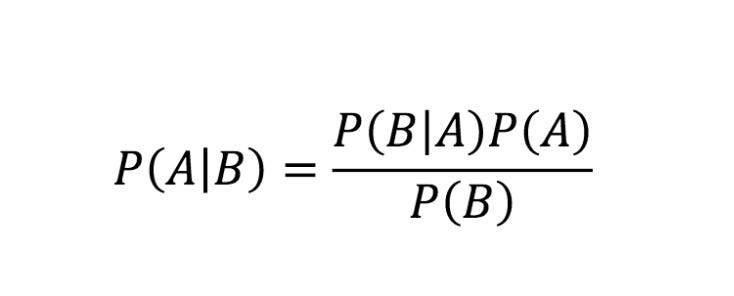
The Bayesian regression model used by Meridian is based on Bayes` Theorem, which is represented by the following equation:
Where:
P(A|B) (Posterior): The probability of A happening given that B is true.
P(B|A) (Likelihood): The probability of seeing evidence B if A is true.
P(A) (Prior): Your initial belief about A before seeing the evidence.
P(B) (Evidence): The total probability of the evidence occurring under all possible scenarios.
So, how would you think of the Bayes Theorem applied to Marketing Mix Modeling?
Instead of a single observation, as the formula suggests, the theorem is used to estimate channel effects across time-series data. For instance, we may start with a prior belief about the expected contribution of a channel like Google Ads, informed by historical performance or domain knowledge.
The likelihood then incorporates observed data while accounting for factors such as seasonality, overlapping channels, and organic demand. By combining the prior with the likelihood, the model infers a posterior distribution over the channel’s contribution.
The theorem would look more like this:
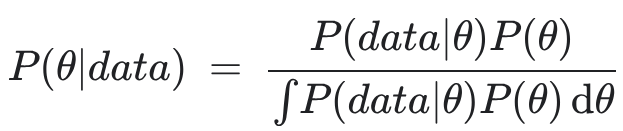
The denominator (evidence) here represents the probability of seeing your actual sales data under every possible combination of channel effects, seasonality, and organic trends.
Why choose Meridian over other MMM frameworks
Now that we’re more familiar with Bayes’ Theorem, we can define our prior expectations about the types of questions Meridian is designed to answer. In practice, these typically include:
How did each marketing channel contribute to revenue or another KPI?
What was the return on ad spend (ROAS)?
How should I allocate my marketing budget going forward to maximize impact?
Where do diminishing returns begin for each marketing channel?
With Meridian, we will be able to answer all of these questions and more. These are some of the key features of this framework:
Works with local, regional, and national data: Analyzes marketing performance at a regional or city level, not just nationally.
Prior knowledge about channel performance: You can include what you already know about your marketing, such as results from past experiments.
Accounts for diminishing returns and delayed effects: Saturation and lagged effects for paid and organic media are modeled using parametric transformation functions.
Supports reach and frequency data: Beyond impressions, Meridian can utilize reach and frequency to gain a deeper understanding of how exposure impacts performance.
Optimizes marketing budgets: You can determine the optimal budget allocation across channels based on your total.
Runs “what-if” scenarios: You can simulate different marketing strategies, such as reallocating spend, and estimate how ROI would change under those scenarios.
Evaluates model quality: You can assess how well the model fits historical data and how it performs on unseen data.
Includes non-media and organic factors: You can optionally include factors such as pricing changes or promotions.
In the next chapter, we are going to see how to train a model using a dataframe with both organic and paid channels.
How to train the Meridian MMM
Before training the data, the first question that arises is to decide which time granularity makes more sense to use: daily, weekly, or monthly.
Training an MMM with daily data would not only take a huge amount of time, especially considering several years, but could also lead to overfitting, and a monthly or quarterly granularity would remove a lot of information regarding seasonality and trends, leading to underfitting.
Therefore, a weekly granularity would be the best approach, but it also depends on the number of features in your dataset and the number of data points you have. According to several articles, there’s a rule of thumb in Marketing Mix Modeling: you should have 10 data points (rows) per feature. So, using weekly granularity would be recommended if you’re using, for instance, 2 years of data (around 104 weeks) and 10 features in your dataset.
In this piece, we are going to work with 3 years of information, so I grouped the data at a weekly level, but I’ve also added information about the month and the quarter because it helps to separate true marketing effects from seasonality and trends.
We are now going to train the dataset above, which includes media spend, non-spend, and organic channels.
Install and set up Meridian
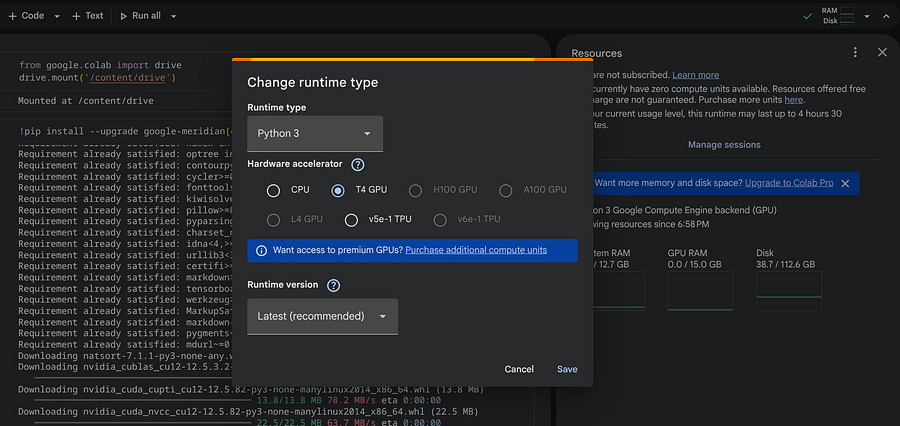
The easiest and fastest way to train the data is by using a Google Colab notebook with a remote GPU. For that, you need to open a notebook and in the top corner, change the runtime type to T4 GPU.
Now, in the first cell of your notebook, you can connect to Google Drive to directly store and fetch data from there.
from google.colab import drive
drive.mount(’/content/drive’)
To install Meridian, you can run this pip command:
!pip install --upgrade google-meridian[colab,and-cuda]Once installed, we can start by structuring the features of the dataset like this:
MEDIA = [
    “instagram_impressions”,
    “x_impressions”,
    “google_clicks”,
    “tik_tok_impressions”,
    “facebook_impressions”]

MEDIA_SPEND = [
    ‘instagram_spend’,
    ‘x_spend’,
    ‘google_spend’,
    ‘tik_tok_spend’,
    ‘facebook_spend’]
ORGANIC_COLS = [
    ‘direct_sessions’,
    ‘organic_impressions’,
    ]
CONTROL_COLS = [’week’, ‘month’, ‘quarter’,  ‘year’]
mapping_media_spend = {
    ‘instagram_spend’: ‘Instagram’,
    ‘x_spend’: ‘X’,
    ‘google_spend’: ‘Google’,
    ‘tik_tok_spend’: ‘Tik Tok’,
    ‘facebook_spend’: ‘Facebook’
}
mapping_media = {
    “instagram_impressions”: “Instagram”,
    “x_impressions”: “X”,
    “google_clicks”: “Google”,
    “tik_tok_impressions”: “Tik Tok”,
    “facebook_impressions”: “Facebook”
}
The MEDIA list contains the user activity, like impressions and clicks. The MEDIA_SPEND list contains the same channels but focuses on spending. Both MEDIA_SPEND and MEDIA are linked through mapping_media_spend and mapping_media, so make sure to have column values for both dictionaries. The ORGANIC_COLS list contains the features that do not require spending. The CONTROL_COLS are all columns related to time.
We can use the above lists and dictionaries to create a mapping object for the model:
from meridian.data import load

coord_to_columns = load.CoordToColumns(
    time=’week’,
    controls=CONTROL_COLS,
    kpi=’revenue’,
    media=MEDIA,
    media_spend=MEDIA_SPEND,
    organic_media=ORGANIC_COLS
)
The KPI is what you’re trying to predict (the target), which in our case is the revenue.
Create the priors
Now comes the trickiest part of the Marketing Mix Modeling steps, which is creating the priors. As we have seen before, the priors, just like the posteriori, are distributions, and they represent the information you provide to the model before it “sees” the data.
A prior can come from multiple sources, including results from past experiments, industry benchmarks, previous MMM results, and your team’s subject matter expertise. In this tutorial, we don’t have previous information about the data, so we are going to use the default priors provided by Meridian.
You can read more about the priors (beliefs) here.
To calculate the default priors, we are going to use the PriorDistribution object from the Meridian library. In addition, we will use the tensorflow_probability package to create distributions.
pip install tensorflow-probabilityWe won’t do any modifications on the default input values, but I’m still going to display them and add comments so you can understand them better:
import tensorflow_probability as tfp
from meridian.model import spec, prior_distribution

prior = prior_distribution.PriorDistribution(
    # LogNormal is used because ROI must be positive.
    # These are Meridian’s recommended defaults when no prior knowledge exists.
    roi_m=tfp.distributions.LogNormal(
        loc=0.2,    # log-mean
        scale=0.9   # log-std (fairly wide -> weakly informative)
    ),
    roi_rf=tfp.distributions.LogNormal(
        loc=0.2,
        scale=0.9
    ),
    # Organic media uses contribution priors.
    # Beta(1, 99) implies a small expected contribution per channel,
    contribution_om=tfp.distributions.Beta(
        concentration1=1.0,
        concentration0=99.0
    ),
    contribution_orf=tfp.distributions.Beta(
        concentration1=1.0,
        concentration0=99.0
    ),
)
The default values are the most flexible when we don’t have any clue about the data, but they can be adjusted accordingly. The model specification will look like this:
from meridian.model import spec

model_spec = spec.ModelSpec(
    # Paid media is modeled using ROI priors
    media_prior_type=”roi”,

    # Organic media is modeled using contribution priors
    organic_media_prior_type=”contribution”,

    # Attach the prior configuration
    prior=prior,
)
Load and train
Now we can create the loader object that takes the coordinates and the mappings previously created for all paid and organic channels:
from meridian.data import load

loader = load.DataFrameDataLoader(
    df=df,
    kpi_type=’revenue’,
    coord_to_columns=coord_to_columns,
    media_to_channel=mapping_media ,
    media_spend_to_channel=mapping_media_spend
)
data = loader.load()
With the loader and the model_spec, we’re ready to instantiate the model:
from meridian.model import model

mmm = model.Meridian(input_data=data, model_spec=model_spec)
Since Meridian is based on a Bayesian model, to train it, we need to sample from the posterior distribution using Markov Chain Monte Carlo (MCMC).
# Initialize and run the model
mmm.sample_prior(500)

# Sample the posterior)
# This is the step that “learns” from your data
mmm.sample_posterior(
    n_chains=4,    # Number of parallel sampling chains (recommend 4-7)
    n_adapt=500,   # Adaptation steps to tune the sampler
    n_burnin=500,  # “Warm-up” samples to throw away
    n_keep=1000,   # Actual samples to keep for your results
    seed=101       # For reproducibility
)
After running the above cell (may take a bit), make sure you save your mode as a pkl file, so you don’t need to run it again:
model.save_mmm(mmm, “/content/drive/MyDrive/mmm_model.pkl”)Get insights from the Meridian model
That’s, you’ve waited a few minutes, and now it’s time to see some results!
The first thing we can do, if you saved the model, is to load in another empty notebook:
mmm = model.load_mmm(”/content/drive/MyDrive/mmm_model.pkl”)Let’s see how well our model fits the data:
from meridian.analysis import visualizer

model_diagnostics = visualizer.ModelDiagnostics(mmm)
model_diagnostics.predictive_accuracy_table()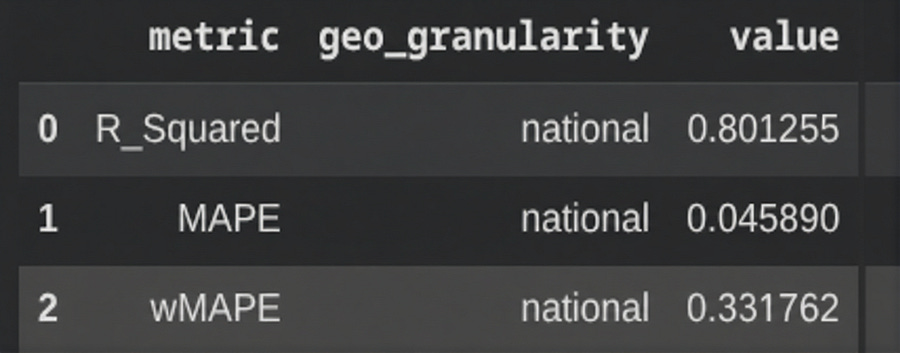
In our case, the R-squared is 0.8. The higher this value, the better the model fitting. However, values that are too high can also indicate overfitting.
When it comes to charts, there are several options. The first chart we can look at is the total spend versus the contribution:
media_summary = visualizer.MediaSummary(mmm)
media_summary.plot_spend_vs_contribution()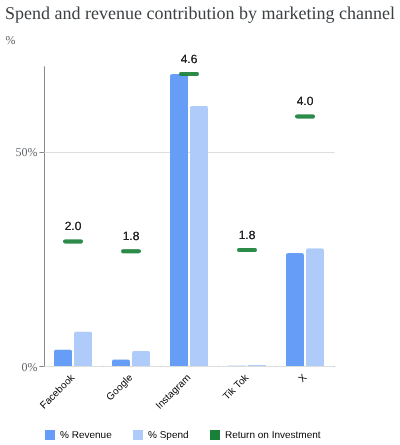
The above chart only takes into account the paid marketing channels. Among them, Instagram shows the highest ROI or ROAS, but it was also the channel with the highest spend. On the other hand, X didn’t require as much money invested to also generate a high ROI. The remaining channels show relatively positive ROI, suggesting potential to scale.
Now, to get the contribution, let’s use a waterfall chart.
media_summary.plot_contribution_waterfall_chart()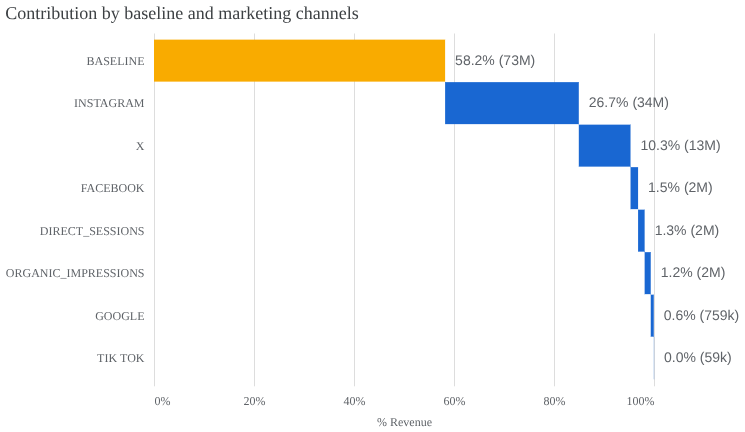
This chart illustrates how total revenue is distributed across both organic and paid marketing channels. In this chart, the baseline is driving the most, meaning that 58.2% of the revenue is not driven by the channels, but by seasonality and other sources. Instagram is the dominant media contributor, accounting for 26.7% of total revenue, followed by X with 10.3%. The organic channels have very little impact on this data sample.
Need help with automation, AI, or data science? Let’s talk.
Conclusion
We could continue generating additional charts, such as adstock decay or diminishing returns. Meridian offers multiple visualizations, but the main goal here was to demonstrate how to create and fine-tune the model, while showcasing a few examples of what an MMM can deliver.
While Meridian includes several built-in charts, you can also extract the dataframes that power these plots and use them to build your own custom charts and dashboards.
Meridian is a very powerful open-source model that, as you’ve seen, significantly simplifies the Marketing Mix Modeling process, without requiring deep knowledge of complex mathematics or statistical functions.
If you are a marketer or data scientist who wants to avoid dependence on cookies, using Meridian, or any other MMM framework, is the way to go.
It's interesting how fast the industry adapts to privacy demands. The move to MMM like Meridian is smart. What if AI models get so good at aggregated predictions that detailed individual tracking becomes completely unnecesary, even for personalized campaigns? Makes you think.