
Build the Coolest Plotly Dashboards with the Dash Mantine Components Library
Power your Python dashboards using React Mantine components and give them a production-ready look.

While Python is one of the top programming languages for data analysis and data visualization, there are still few libraries and frameworks capable of delivering production-ready dashboards.
Libraries like Seaborn, Matplotlib, and Bokeh, are great for exploratory data analysis, building reports, and even Graphical User Interfaces (GUIs), but they don’t natively support HTML, CSS, and JavaScript. Therefore, they are not suitable for web applications.
Solutions such as Gradio and Taipy were built to facilitate Data Scientists and Machine Learning (ML) engineers building Proof of Concepts, Demos, and simple interfaces, where the main focus is to test a product, rather than making it ready for production.
Let’s now have a look at the top framework to build insightful and appealing dashboards and its limitations.
The best framework for data visualization
The top framework to build advanced dashboards, with an extensive list of components and flexibility of customization, is Dash Plotly.
This framework is fully open-source and it’s available for both Python and JavaScript, which makes it widely used, with many examples available on GitHub and forums. This vast publicly available data made Large Language Models proficient in building Plotly dashboards, which eases dashboard creation through vibe coding.
Standard Dash Plotly components are built with React, and they can be customized in order to look more appealing and suitable for your needs. There’s even a React tutorial for Python developers, so you can start building without requiring learning React from scratch.
The fast approach
But let’s say you don’t want to spend countless hours customizing your components. In that case, you can use open-source libraries such as Dash Bootstrap Components and many more, which you can find here.
Among the several examples on the list above, there’s one that will make your dashboards absolutely beautiful!
That’s Dash Mantime Components, with over 90 components from the React Mantine library.
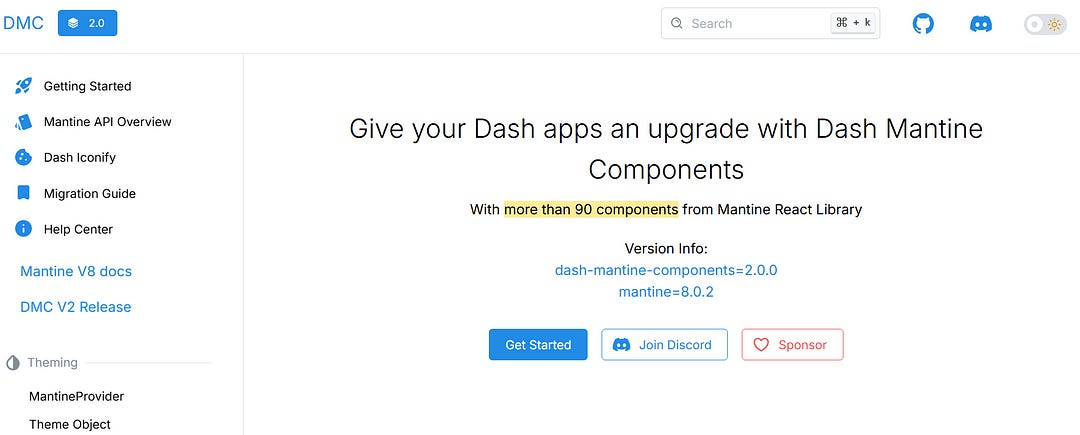
Compared to other Dash Plotly libraries, DMC offers a modern look, with easy customization, requiring less HTML and CSS knowledge.
First steps with Dash Mantine library
One good practice for building dashboards in Python is to first create a Flask server. This gives you more flexibility in case you want to add pages that are not built using Dash or add extra parameters to the server.
Let’s also install Dash and DMC.
pip install flask dash dash-mantine-componentsOnce installed, we can start building a simple dashboard. Let’s create a login page:
from dash import Dash, _dash_renderer
from dash import dcc, html
import dash_mantine_components as dmc
from flask import Flask

# Flask server
server = Flask(__name__)
server.secret_key = 'parenting'

# Set the react version for DMC components
_dash_renderer._set_react_version("18.2.0")

# Stylesheets
external_stylesheets = [
    dmc.styles.ALL,
    dmc.styles.CHARTS
]

# Set up a single Dash app with multiple pages
app = Dash(
    name='parenting_dashboard',
    server=server,
    title='Parenting Dashboard',
    external_stylesheets=external_stylesheets,
    assets_folder='assets')

# Define the layout for the different pages
app.layout = dmc.MantineProvider([
    dmc.LoadingOverlay(
        id="loading-overlay-login",
        visible=True,
        loaderProps={
            "color": "#f08b56",
            "size": "md"
        },
        style={
            "background": "white",
            "opacity": 1,
        }
    ),
    dcc.Location(id='url', refresh=False),
    dcc.Store(id='store', storage_type='session'),
    dcc.Store(id='current-page', storage_type='session'),
    html.Div(
        dmc.Stack([
            dmc.TextInput(
                id="username",
                label="Username",
                size="lg",
                miw=300,
                placeholder="Enter your username",
                required=True,
            ),
            dmc.PasswordInput(
                id="password",
                label="Password",
                size="lg",
                miw=300,
                placeholder="Enter your password",
                required=True,
            ),
            dmc.Button(
                "Login",
                id="login-button",
                size="lg",
                miw=300,
                color="#f08b56"
            ),
            dmc.Alert(
                "Invalid credentials",
                title="Error",
                hide=True,
                id="alert-login",
                color="red",
                withCloseButton=True,
            ),
        ],
            justify="center",
            align="center",
            style={
                "width": "100%",
        },
            className="main-container-login"
        ),
        id="main-container",
    ),
])

if __name__ == '__main__':
    # Run the server
    server.run(host='0.0.0.0', port=8080, debug=True)
Overall, this main.py code snippet does the following:
Creates a Flask server.
Sets the React version to 18.2.0 using
_dash_renderer.Adds DMC styles. You should be able to get all styles with
dmc.styles.ALL, but if not, you can add them individually likedmc.styles.Charts.Instantiates the dash application using
Dash, where a name and a title are given, along with the Flask server, the stylesheets, and the assets folder that contains the CSS files.Wraps the login page inside the
dmc.MantineProviderobject, which is key to rendering the DMC library components.Finally, launches the Flask server on port 8080.
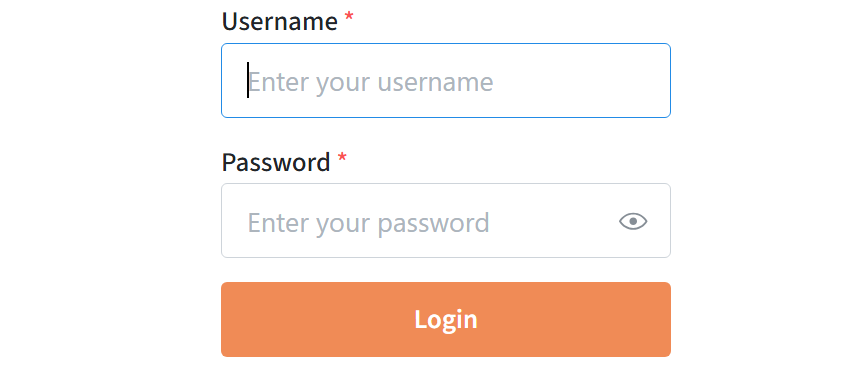
This first page looks like this:
Callbacks and other DMC components
The previous login page requires a username and a password. Otherwise, it prompts an alert message.
Let’s take a look at the callback function that handles the authentication.
from dash.dependencies import Output, Input, State, ALL
from dash import no_update, clientside_callback
from app.components import Login
from app.settings import ParentingSettings


class Callbacks:
    """
    Class to handle main callbacks for the app.
    """

    @staticmethod
    def callback_login(app):
        """
        Callback function to handle the login.
        """
        @app.callback(
            Output('store', 'data'),
            Output('alert-login', 'hide'),
            Output('login-button', 'n_clicks'),
            Input('login-button', 'n_clicks'),
            State('username', 'value'),
            State('password', 'value'),
        )
        def login(n_clicks, username, password):
            if n_clicks is None:
                return no_update, True, 0
            if n_clicks > 0:
                if username == 'toddler' and password == 'parent123':
                    return 'toddler', True, 0
                elif username == 'preschooler' and password == 'parent456':
                    return 'preschooler', True, 0
                else:
                    return no_update, False, 0
By using the ids previously defined in the layout, we can create inputs and outputs. The callback function above takes the username, the password, and the button as inputs. The State is a type of Input, that uses its values but does not require an action. This avoids triggering the callback if the user fills in the dmc.TextInput or the dmc.PasswordInput.
The outputs of this callback are simply the hidden value for the alert component and store value. The latter will be saved in the session of the browser, and based on it, you can generate different layouts. This is important when handling different clients.
@staticmethod
def callback_store(app):
    """
    Callback function to handle the store value.
    """
    @app.callback(
        Output('main-container', 'children'),
        Output('loading-overlay-login', 'visible', allow_duplicate=True),
        Input('store', 'data'),
        prevent_initial_call=True,
    )
    def parenting_category(category):
        if category == 'toddler':
            main_container = Store.gen_navbar(category)
            return main_container, False
        if category == 'preschooler':
            main_container = Store.gen_navbar(category)
            return main_container, False
        else:
            return Login.gen_login_form(), False
Once logged in, the session value triggers the callback function above, and a layout is generated accordingly.
⚠️Note: Each new callback function should be added to the main.py function to be triggered.
Build a navbar with DMC
After the authentication, a new layout is shown inside the dmc.MantineProvider. Let’s have a look at a common piece on a dashboard, a navbar with selectors to control the charts.
import dash_mantine_components as dmc
from dash_iconify import DashIconify

def gen_navbar(category):
    """
    Generate the navbar based on the parenting category.

    Args:
        category (str): The parenting category to
        generate the navbar for (eg. "toddler", "preschooler")

    Returns:
        html.Div: The navbar for the parenting category.
    """

    max_date = datetime.now()
    min_date = datetime(2024, 1, 1)

    settings = ParentingSettings(category)

    return \
        html.Div([
            html.Div([
                dmc.Stack([
                    dmc.DatePickerInput(
                        id="start-date-input",
                        value=max_date - timedelta(days=30),
                        label="Start Date",
                        className="nav-item",
                        required=True,
                        minDate=min_date,
                    ),
                    dmc.DatePickerInput(
                        id="end-date-input",
                        value=max_date,
                        label="End Date",
                        className="nav-item",
                        required=True,
                        maxDate=max_date,
                    ),
                    dmc.Select(
                        id="activity-selector",
                        leftSection=DashIconify(
                            icon="mdi:baby-face"),
                        data=settings.properties_selector,
                        label="Select Activity Type",
                        searchable=True,
                        value=settings.properties_selector[0]['value'],
                        className="nav-item"
                    ),
                    dmc.Select(
                        id="pages-dropdown",
                        leftSection=DashIconify(
                            icon="material-symbols:bar-chart"),
                        searchable=True,
                        label="Dashboard Page",
                        comboboxProps={
                            "transitionProps": {
                                "transition": "pop", "duration": 200}},
                        data=settings.pages_selector,
                        value='dialogs',
                        className="nav-item",
                    ),
                    dmc.RadioGroup(
                        children=dmc.Group(
                            [dmc.Radio(l, value=k, color=c, id=d) for
                             k, l, c, d
                             in settings.timeframes_radio_options],
                            my=10),
                        id="radiogroup-timeframes",
                        value="week",
                        label="Select a Timeframe",
                        size="sm",
                        mb=10,
                        className="nav-item"
                    ),
                    dmc.Space(h=20),
                    html.Div([
                        dmc.Button(
                            "Sign Out",
                            id="log-out-button",
                            color="#f08b56",
                            leftSection=DashIconify(
                                icon="material-symbols:logout"),
                            size="xs",
                            n_clicks=0,
                        )
                    ], className="nav-item", style={"margin": "auto"}),
                ])
            ], className="navbar-col"),
            html.Div(id="page-content")],
            id="main-container",
            style={
                "display": "flex",
                "minHeight": "100vh",
                "width": "100%",
        }
        )
The layout above is controlled by the store value (category), which in our example can either be toddler or preschooler. This category is then used to create specific components and logic for the dashboard.
Now back to the DMC elements, the dmc.Stack component is useful to align the items vertically, while the dmc.Group is used for horizontal alignment.
These are the controlling widgets being used in the navbar:
dmc.DatePickerInput()used for picking dates. You can control the minimum and maximum dates.dmc.Select(), a dropdown element. Takes the data input as a dictionary.dmc.RadioGroup(), a group of radio buttons. You can customize them individually withdmc.Radio().dmc.Button(), a simple button.
This is how the navbar looks like:
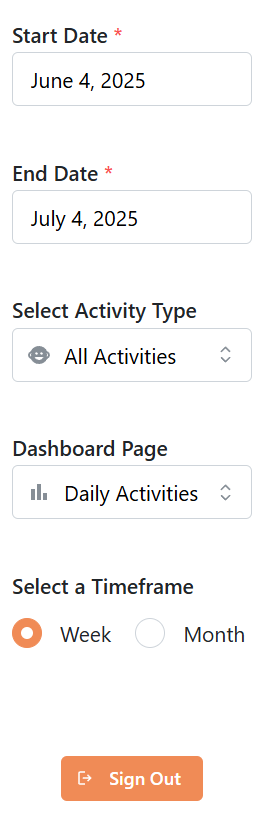
Did you see the cool icons? That’s possible with the DashIconify object. You can install this library with pip:
pip install dash-iconifyOnce installed, you can integrate the DashIconify into your control widgets and select icons from a library with thousands of options. Find them here.
Pagination with DMC
We can now have a look at the callback function that powers the pagination of the dashboard using the following data for the page selector:
[
  {"label": "Daily Activities", "value": "daily"},
  {"label": "Sleep Patterns", "value": "sleep"},
  {"label": "Meal Tracking", "value": "meal"},
  {"label": "Development Milestones", "value": "development"},
  {"label": "Health Issues", "value": "health"},
  {"label": "Behavior Notes", "value": "behavior"},
 ]
In brief, we aim to render a page on the left side of the navbar, based on the selected value. This page layout will be displayed in the id page-content and it can show charts, tables, and overall data insights.
Let’s have a quick look at the callback logic:
  @staticmethod
  def callback_page_layout(app):
      """
      Callback function to open the layout according to the dashboard input.
      """
      @app.callback(
          Output('page-content', 'children'),
          Output('url', 'pathname'),
          Input('store', 'data'),
          Input('pages-dropdown', 'value'),
      )
      def display_page(category: str, page: str):

          if page == 'daily':
              return gen_daily_layout(category), '/'
          elif page == 'sleep':
              return gen_sleep_layout(category), '/sleep',
          elif page == 'meal':
              return gen_meal_layout(category), '/meal'
          elif page == 'development':
              return gen_development_layout(category), '/development',
          elif page == 'health':
              return gen_health_layout(category), '/health',
          elif page == 'behavior':
              return gen_behavior_layout(category), '/behavior',
The function above takes a page dropdown value as input, as well as the stored value category, and outputs a layout on page-content while redirecting to the target URL pathname.
This logic creates something like this:
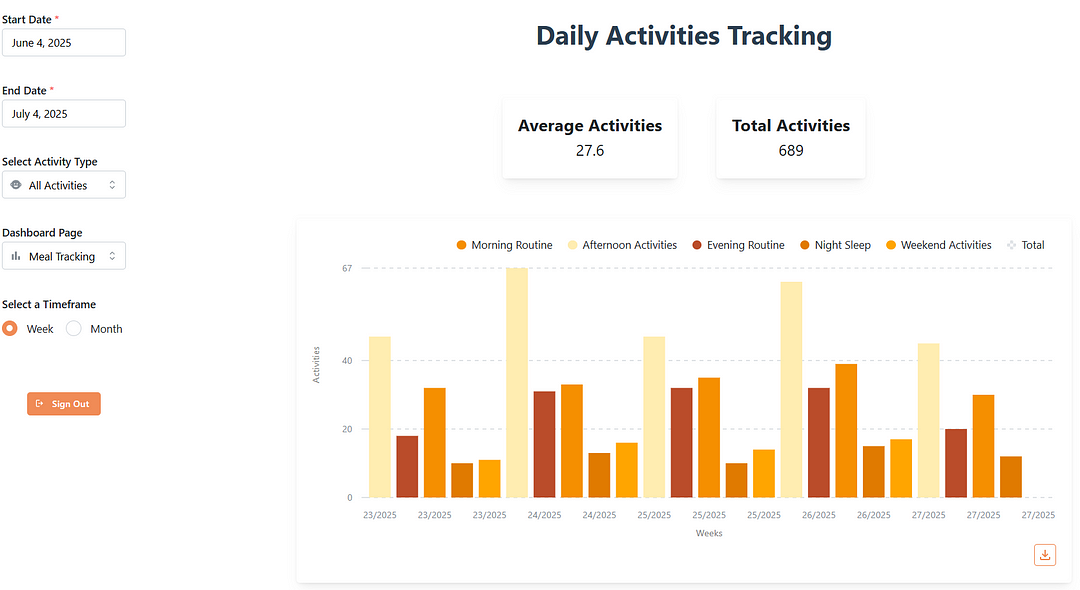
The idea is that the navbar is fixed, and only the Div element on the left (page-content), changes every time the user switches pages.
Create charts with DMC
Cool, so we finally start to see the dashboard flourishing! Let’s have a look at some DMC charts and how they differ from the standard Dash Plotly ones.
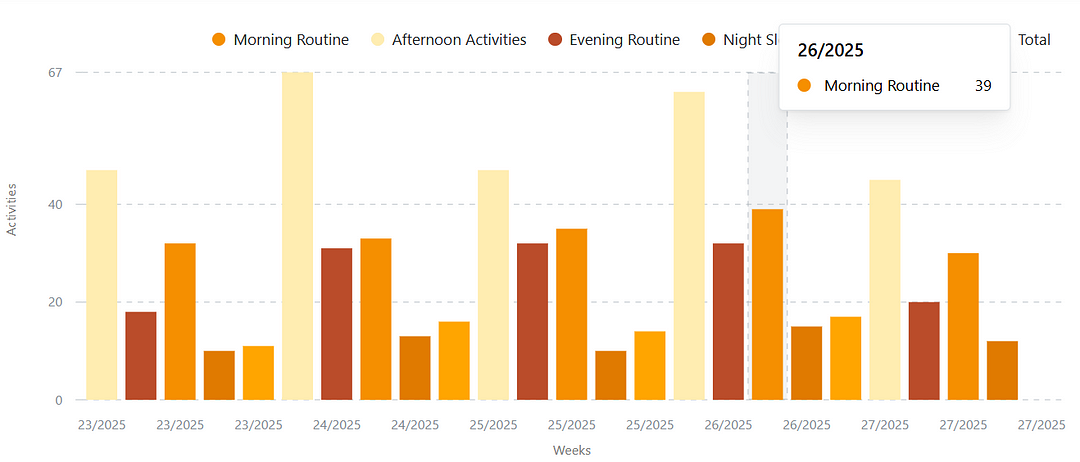
The bar chart we saw above was built using the following function:
from dash import html, dcc
import dash_mantine_components as dmc
from app.settings import ParentingSettings
from dash_iconify import DashIconify
from app.components import General
from datetime import datetime, timedelta


@staticmethod
 def gen_daily_layout(category):
      """
      Generate the layout for the daily activities page.
      """

      settings = ParentingSettings(category)

      return html.Div([
          dmc.Title(
              "Daily Activities Tracking",
              className="dashboard-page-title",
              order=1
          ),
          dmc.Space(h=40),
          dmc.Stack([
              General.gen_loading("loading-overlay-daily"),
              dmc.Group([
                  General.gen_paper_box(
                      "Average Activities", "avg-daily-text"),
                  General.gen_paper_box(
                      "Total Activities", "total-daily-text"),
              ], gap=50),
              dmc.Space(h=20),
              dmc.Paper([
                  dmc.BarChart(
                      id="bar-chart-daily",
                      withLegend=True,
                      maw=1000,
                      h=400,
                      data=[],
                      withTooltip=True,
                      dataKey="weekYear",
                      type="stacked",
                      xAxisLabel="Weeks",
                      yAxisLabel="Activities",
                      yAxisProps={
                              "domain": [0, "dataMax"],
                              "allowDataOverflow": True,
                      },
                      style={"width": "100%"},
                      series=settings.properties_default_series
                  ),
                  General.gen_download_button("download-button-daily",
                                              margin_left='auto'),
                  dcc.Download(id="download-data-daily"),
              ],
                  style={"width": "100%"},
                  maw=1000, radius="sm", p="lg", shadow="sm"),
          ], align="center"),
      ], className="dashboard-page-content")
In the script above, the object that creates the bar chart is dmc.BarChart and takes a few inputs to generate a modern-looking dynamic plot.
Standard libraries require a lot of customization to prettify the charts. Otherwise, they look like this:
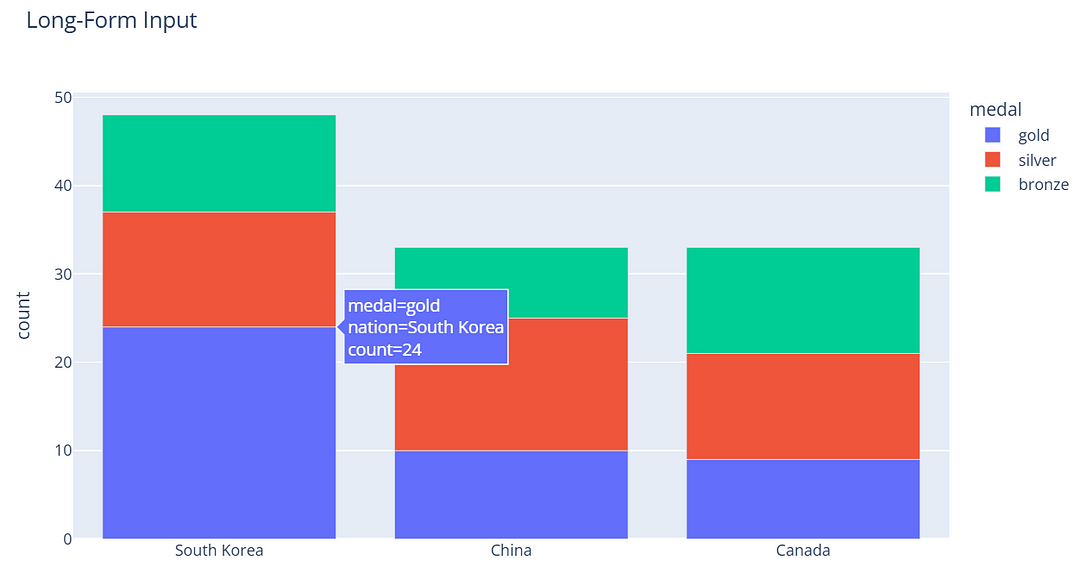
Not amazing, right? This is the DMC version with almost no customization:
More examples:
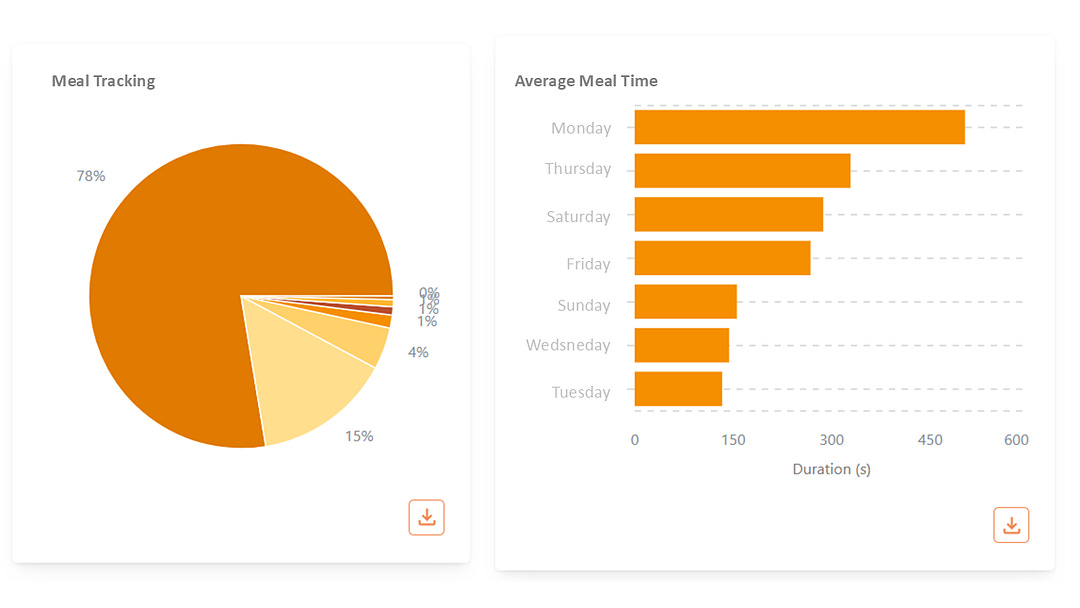
These are just some examples. We could go on and explore even further! You can try to build other types of charts and play with callback functions by following the DMC documentation.
Need help with automation, AI, or data science? Let’s talk.
Conclusion
While the Dash Mantine Components library offers great-looking charts and widgets compared to standard Plotly libraries, it still has some limitations.
For instance, if you want to create a funnel chart, you won’t find an object in DMC for it. You would need to stick with Plotly Express or Graph Objects.
This can be a problem, mostly if all your elements are DMC and suddenly some of them have a different, less modern look.
Nonetheless, the DMC repository is still active on GitHub, last commit 4 days ago at the time I’m writing, meaning that more components may be added soon.
Another important point of this library compared to using traditional Plotly components is that it is not great for vibe coders. I’m a Cursor user, and I found it hard to create DMC elements using the composer.
Therefore, take your time, read the documentation, and start building production-ready dashboards with Python.